|
|
|
 |
|
Find
out your BMI (body mass index), it's easy with our BMI chart, see what your body mass index means.
Body Mass
Index is a number calculated from an individual’s weight
and height, that is used to determine whether a person is
within, or outside of, a normal weight range. Use the Body
Mass Index Chart to look up your BMI, and use the table
below it to see what range you fall into.
Not
on the chart?>>
Body
Mass Index Chart
| |
Weight |
|
4’10 |
|
5’0 |
|
5’2 |
|
5’4 |
|
5’6 |
|
5’8 |
|
5’10 |
|
6’0 |
|
6’2 |
|
6’4 |
|
| |
7st
0 |
|
20.6 |
|
19.2 |
|
18.0 |
|
16.9 |
|
15.9 |
|
15.0 |
|
14.1 |
|
13.3 |
|
12.6 |
|
12.0 |
|
| |
7st 7 |
|
22.0 |
|
20.6 |
|
19.3 |
|
18.1 |
|
17.0 |
|
16.0 |
|
15.1 |
|
14.3 |
|
13.5 |
|
12.8 |
|
| |
8st
0 |
|
23.5 |
|
22.0 |
|
20.6 |
|
19.3 |
|
18.1 |
|
17.1 |
|
16.1 |
|
15.2 |
|
14.4 |
|
13.7 |
|
| |
8st 7 |
|
25.0 |
|
23.3 |
|
21.8 |
|
20.5 |
|
19.3 |
|
18.2 |
|
17.1 |
|
16.2 |
|
15.3 |
|
14.5 |
|
| |
9st
0 |
|
26.4 |
|
24.7 |
|
23.1 |
|
21.7 |
|
20.4 |
|
19.2 |
|
18.1 |
|
17.2 |
|
16.2 |
|
15.4 |
|
| |
9st 7 |
|
27.9 |
|
26.1 |
|
24.4 |
|
22.9 |
|
21.5 |
|
20.3 |
|
19.2 |
|
18.1 |
|
17.1 |
|
16.2 |
|
| |
10st
0 |
|
29.4 |
|
27.4 |
|
25.7 |
|
24.1 |
|
22.7 |
|
21.4 |
|
20.2 |
|
19.1 |
|
18.0 |
|
17.1 |
|
| |
10st 7 |
|
30.8 |
|
28.8 |
|
27.0 |
|
25.3 |
|
23.8 |
|
22.4 |
|
21.2 |
|
20.0 |
|
18.9 |
|
18.0 |
|
| |
11st
0 |
|
32.3 |
|
30.2 |
|
28.3 |
|
26.5 |
|
24.9 |
|
23.5 |
|
22.2 |
|
21.0 |
|
19.8 |
|
18.8 |
|
| |
11st 7 |
|
33.8 |
|
31.6 |
|
29.6 |
|
27.7 |
|
26.1 |
|
24.6 |
|
23.2 |
|
21.9 |
|
20.7 |
|
19.7 |
|
| |
12st
0 |
|
35.2 |
|
32.9 |
|
30.8 |
|
28.9 |
|
27.2 |
|
25.6 |
|
24.2 |
|
22.9 |
|
21.6 |
|
20.5 |
|
| |
12st 7 |
|
36.7 |
|
34.3 |
|
32.1 |
|
30.1 |
|
28.3 |
|
26.7 |
|
25.2 |
|
23.8 |
|
22.5 |
|
21.4 |
|
| |
13st
0 |
|
38.2 |
|
35.7 |
|
33.4 |
|
31.4 |
|
29.5 |
|
27.8 |
|
26.2 |
|
24.8 |
|
23.5 |
|
22.2 |
|
| |
13st 7 |
|
39.6 |
|
37.0 |
|
34.7 |
|
32.6 |
|
30.6 |
|
28.8 |
|
27.2 |
|
25.7 |
|
24.4 |
|
23.1 |
|
| |
14st
0 |
|
41.1 |
|
38.4 |
|
36.0 |
|
33.8 |
|
31.7 |
|
29.9 |
|
28.2 |
|
26.7 |
|
25.3 |
|
23.9 |
|
| |
14st
7 |
|
42.6 |
|
39.8 |
|
37.3 |
|
35.0 |
|
32.9 |
|
31.0 |
|
29.2 |
|
27.6 |
|
26.2 |
|
24.8 |
|
| |
15st
0 |
|
44.0 |
|
41.2 |
|
38.5 |
|
36.2 |
|
34.0 |
|
32.0 |
|
30.2 |
|
28.6 |
|
27.1 |
|
25.7 |
|
| |
15st
7 |
|
45.5 |
|
42.5 |
|
39.8 |
|
37.4 |
|
35.2 |
|
33.1 |
|
31.2 |
|
29.5 |
|
28.0 |
|
26.5 |
|
| |
16st
0 |
|
47.0 |
|
43.9 |
|
41.1 |
|
38.6 |
|
36.3 |
|
34.2 |
|
32.3 |
|
30.5 |
|
28.9 |
|
27.4 |
|
| |
16st
7 |
|
48.5 |
|
45.3 |
|
42.4 |
|
39.8 |
|
37.4 |
|
35.2 |
|
33.3 |
|
31.4 |
|
29.8 |
|
28.2 |
|
| |
17st
0 |
|
49.9 |
|
46.6 |
|
43.7 |
|
41.0 |
|
38.6 |
|
36.3 |
|
34.3 |
|
32.4 |
|
30.7 |
|
29.1 |
|
| |
17st
7 |
|
51.4 |
|
48.0 |
|
45.0 |
|
42.2 |
|
39.7 |
|
37.4 |
|
35.3 |
|
33.3 |
|
31.6 |
|
29.9 |
|
| |
18st
0 |
|
52.9 |
|
49.4 |
|
46.3 |
|
43.4 |
|
40.8 |
|
38.5 |
|
36.3 |
|
34.3 |
|
32.5 |
|
30.8 |
|
| |
18st
7 |
|
54.3 |
|
50.8 |
|
47.5 |
|
44.6 |
|
42.0 |
|
39.5 |
|
37.3 |
|
35.3 |
|
33.4 |
|
31.6 |
|
| |
19st
0 |
|
55.8 |
|
52.1 |
|
48.8 |
|
45.8 |
|
43.1 |
|
40.6 |
|
38.3 |
|
36.2 |
|
34.3 |
|
32.5 |
|
| |
19st
7 |
|
57.3 |
|
53.5 |
|
50.1 |
|
47.0 |
|
44.2 |
|
41.7 |
|
39.3 |
|
37.2 |
|
35.2 |
|
33.3 |
|
| |
20st
0 |
|
58.7 |
|
54.9 |
|
51.4 |
|
48.2 |
|
45.4 |
|
42.7 |
|
40.3 |
|
38.1 |
|
36.1 |
|
34.2 |
|
| |
Stones
/ Lbs |
|
4’10 |
|
5’0 |
|
5’2 |
|
5’4 |
|
5’6 |
|
5’8 |
|
5’10 |
|
6’0 |
|
6’2 |
|
6’4 |
|
Not
on the chart?>>
BMI
Less than 20 — Under Weight

BMI 20-25 — Normal Weight
BMI 25-30 — Over Weight
BMI 30-40 — Obese
BMI Over 40 — Severely Obese
The
spread from 20-25 shows that what is normal covers quite a
big range. This is because ‘normal’ weight for height
covers both men and women, and people of different shapes
and body composition. A man would normally be expected to
have a higher BMI than a woman of the same height, because
men tend to have more muscle than women (women naturally
have more fat) and muscle weighs more per square inch than
fat. For the same reason a slim, muscular woman will have a
higher BMI (i.e. weigh more) than a slim, not very muscular
woman of the same height.
>What's
My Ideal Weight?
<back
to resources
|
|
|
|
|
|
What's
My Ideal
Weight? |
|
Find
out with our ideal weight charts, based on Body Mass Index.

|
|
2010 Edition |
|
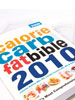
The
most comprehensive nutrition book ever — lists
over 22,000 basic and branded foods |

This clever little disc will calculate your BMI in metric or imperial

|
